
Venn Diagrams are great to help students visualize the skill of comparing and contrasting.
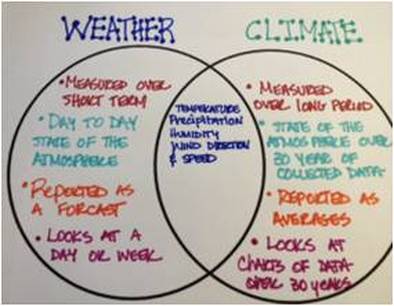
You can have students add the information in by hand.
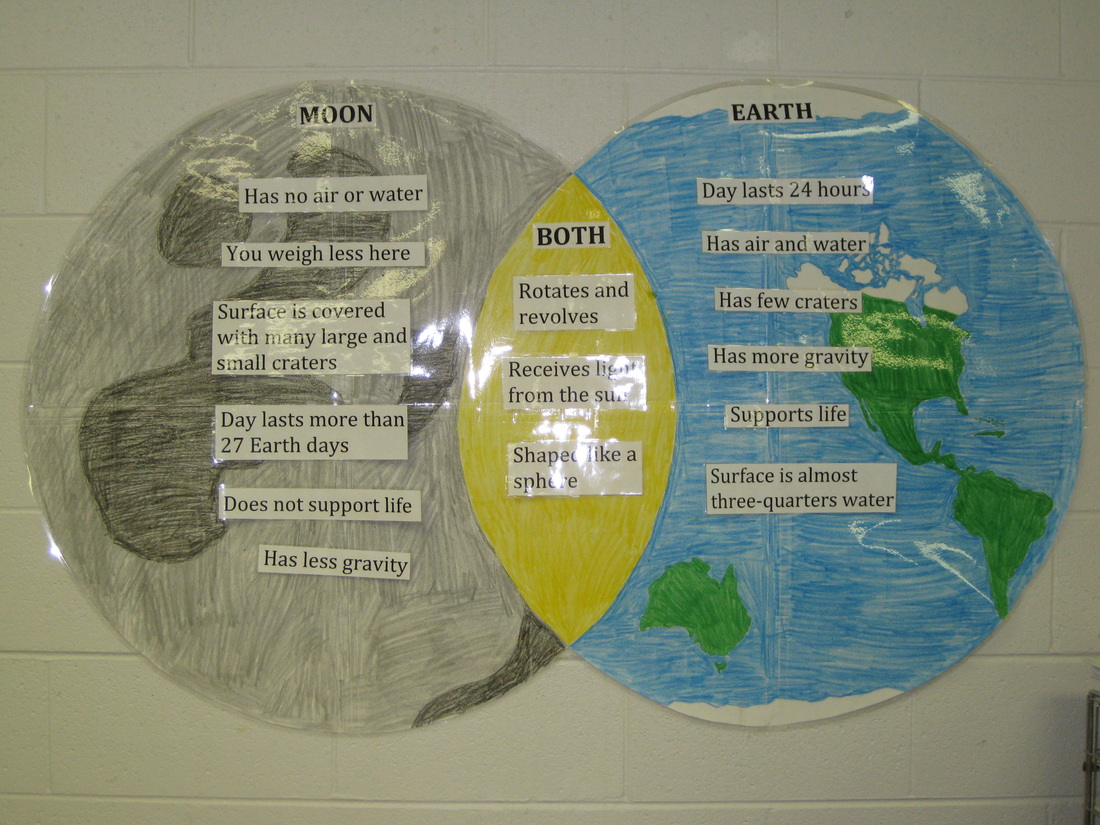
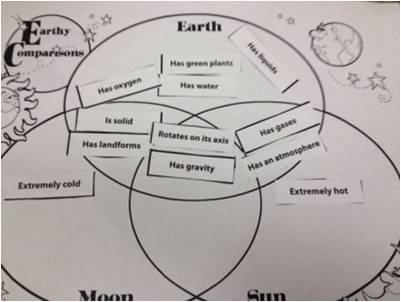
A great way to accommodate is to have information typed out in strips and students place the information in the appropriate section.
Once you have a venn diagram set up in the journal, you can easily make it interactive by making it into a built-in foldable.
Once you have a venn diagram set up in the journal, you can easily make it interactive by making it into a built-in foldable.
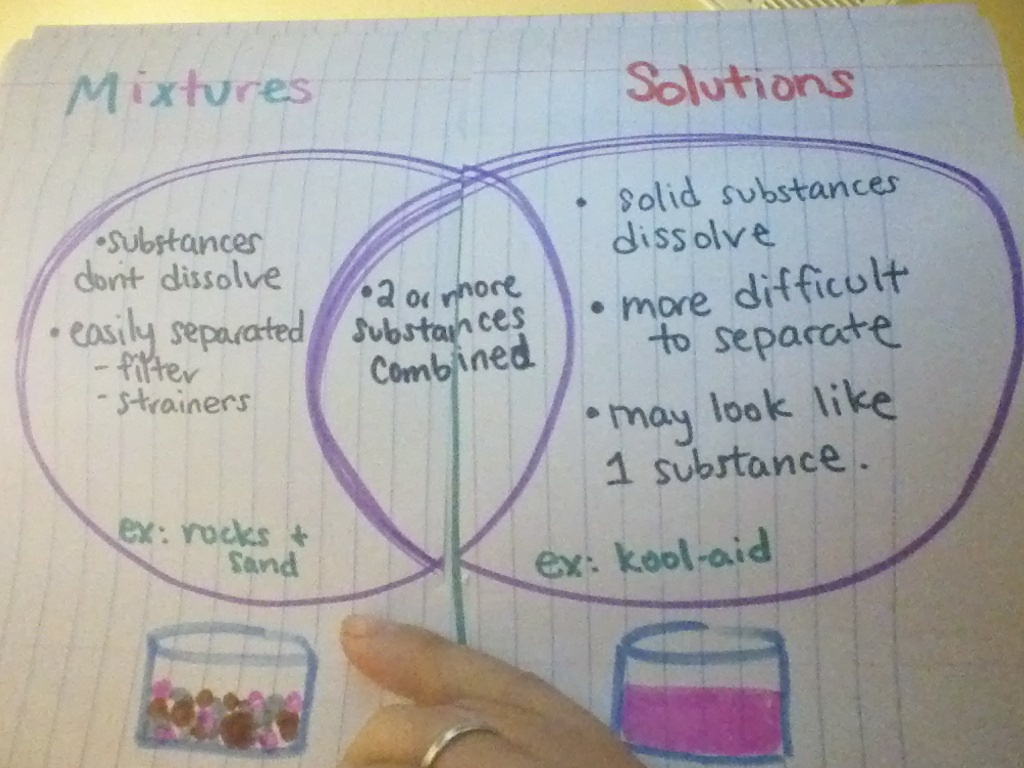
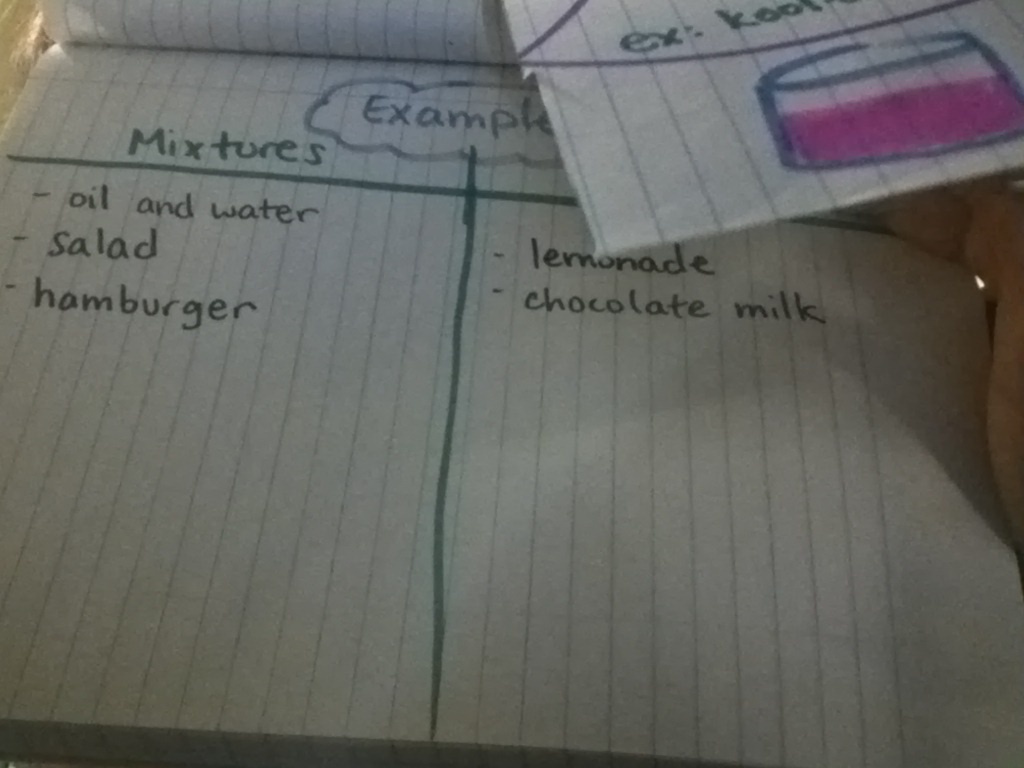
See how there's a cut down the middle of the page? Well, flip the flaps over and you now have a T-chart for students to list examples of mixtures and solutions. You can give them a list and have them decide where each goes based on the definitions provided in their notes.
Or, you can make this an inquiry lab and use concept attainment for students to generate the 2 lists first, and then make the venn diagram. Concept attainment model idea: prepare a bunch of pictures of both solutions and mixtures. Have students write "no" above one column and "yes" above the other column. Show students one picture at a time and tell them if it goes with the "no" or "yes." After a few, ask students to guess what all the things in the "yes" column have in common.
 RSS Feed